An agent based model for a catalysed economy
Adding documentation for the NetLogo model, from the .nlogo file submitted for final project of Agent Based Modeling course at Complexity Explorer in August 2024.
WHAT IS IT? Scope of the Model.
This is a model of an artificial economical system made up of firms/factories. This is an attempt to develop a simple enough model to capture some aspects of production in various firms. Each firm is an agent that can generate a unique product or goods as we will call them in the rest of the document.
The factories are placed in a 2 dimensional plane, the whole two dimensional plane is assumed to be abundant in resources (shown by green colored patches) Each firm can work on its own using environmental resources. At the same time, the firms can be 'catalyzed represented by links in the network. A link from firm A to firm B implies. that the existence of Firm A benefits Firm B. This is done by assuming that the goods produced by farm A can be used in the production process to increase the rate of production.
For example, Firm A could be a firm that creates Nails using metal from the environment. And Firm B could be a firm that produces furniture. So, a link can exist from A to B. As Firm B could use nails created by Firm A to generate their own output (tables). A single agent can receive multiple incoming links as well, for example firm B could have another incoming link from Firm C which generates hammers
This model is inspired by concept of "economic autocatalytic sets(E-ACS)" recently used by Hordijk et al (2023)[1]. It talks about self reinforcing, self reliant set of entities that could exist in economies (called E-ACS) whose links provide feedback and thus they perform better.
I have created an economy model where we could show how the existence of links and catalysis' can help sustain the whole economy (See things to try and things to notice for further).
The final goal was to make the model dynamically evolving, but the results are not clear yet and need further analyses. More on this in Extending the model
Note: If the model shows an error of "factory" shape not present, please go to Tools >> Turtle Shapes Editor->Import from Library=> Select Factory shape-> Click on import..
HOW IT WORKS
Agents Selection
There are two types of agents in my model:
Patches: These are the normal patches that form the grid of the 2-D environment. They represent geographical positions where the firms are situated. The patches are filled with finite resources (like metal, wood, labour, water.etc) which firms can use to generate output.
Firms: These are factories that use resources from patches around them and generate products or goods. These goods are unique for each firm by assumption. Each firm is fixed in the 2-D plane and each firm can catalyze any other firm with some probability that we call 'link-prob'
Agents Properties
Patches have following user defined property:
Resources: Denotes the amount of resources available in each patch. It is an integer and is fixed for each patch in Setup procedure. For simplicity we assume each patch has all the different types of resources that could be required in the system and they are counted in a single number. The number is assigned using *patch-resource- global variable.
Firms have following defined properties:
Cash: The amount of cash(revenue) that is available for a firm at any instant of time. This is the revenue they use to generate output, incur the working cost and buy other goods.
output: The number of goods this firm has available stored, cumulative of the goods the firm has created till present minus the goods they have sold.
rel-output: Relative output for the firm, which is normalised by the total output of the whole system.
daily-output: The amount of goods created by the firm in a single day.
rel-daily: Relative daily output for the firm again using the total daily output as the normaization.
initx: Initial x-coordinate for restoring firms to original position.
inity: Initial y-coordinate for restoring firms to original position.
price: Price of the goods that the firm creates. Could be a constant for the whole system, or it could also be dynamically changing. For e.g. in our model it follows a simple demand rule.
sell?: Boolean variable depicting whether the firm will sell some of its products or not.
active?: Boolean variable depicting whether the firm will generate an economic output.
nsold: Number of goods sold in a single day.
nshared: Number of goods sold/shared through internal links in the network (catalysis)
dead?: Boolean variable representing whether the firm is okay and working or not.
HOW TO USE IT
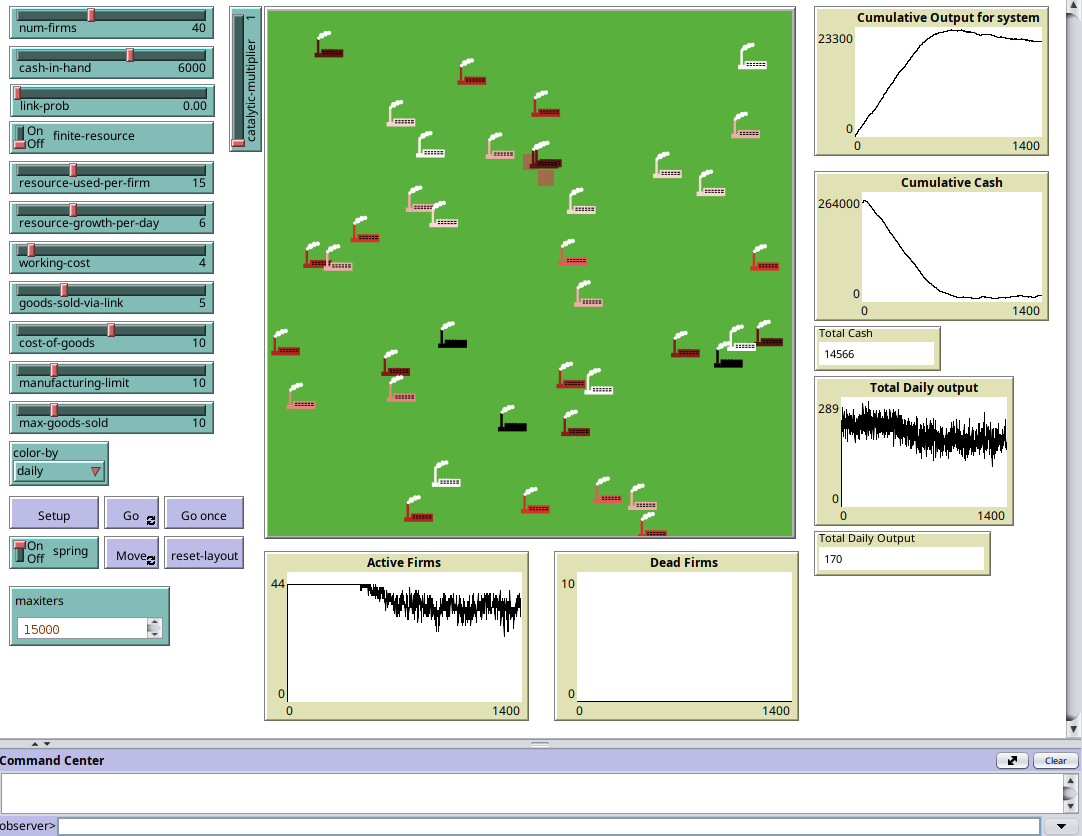
(how to use the model, including a description of each of the items in the Interface tab)
Use the setup button to generate a random system placing N (num-firms) factories. It places them randomly in the 2 dimensional plane, the setup button also populates each patch with fixed number of resources also coloring them green.
The cash-in-hand slider fixes the amount of cash each firm begins with.
link-prob slider fixes the probability that a firm catalyses the production of another firm. It goes from 0 to 1.
catalytic-multiplier: The multiplicative factor that has a positive impact on the production of the firm.
finite-resource toggle switches between an environment where each patch just gets 10 resources (On), or one where each patch gets 1000 resources. So, turning this off effectively removes the resource crunch effect on the firm's productivity. You can think of this as a buffer constant supply of resources.
resource-used-per-firm and resource-growth-per-day are again two measures of resource usage and renewal respectively. The meanings are self explanatory from the names.
Working-cost: Working cost required for a firm to create one good.
goods-sold-via-link: The goods that are exchanged from the feeder firm to the recieving firm.
cost-of-goods: This comprises of the 'default ' price of any firm in the system.
Manufacturing limit: Maximum amount of goods that a firm can produce a single day.
max-goods-sold: Maximum amount of goods a firm can sell to the public.
spring toggle: This turns on the spring force between agents. You can then use the move button to display the agents more clearly when there are many links.
reset-layout: This button moves all the firms back to their own positions from the setup.
Description of actions taken by the agents (Setup and Go)
After you click on the Go button, an iteration begins. In the beginning of the iteration each firm is asked if they have enough cash. i.e. more than the minimum allowed revenue (dictated by a global variable). If the turtle/firm has the revenue, it asks for its Von Neumann neighborhood if any one of them have a single unit of resource. If they have we set the agent as active. Otherwise the agent remains inactive.
In the next step we check if the firm is active or not, if they are active, the output is quickly calculated.
The nodes are colored either by relative-daily output or relative output.
Output is caculated using operate-firm procedure.
In the procedure, if there is no incoming link then the firm produces a random number of goods for the day between 1 and the manufacturing-limit
If there are any incoming links to the form, each of its effect is measured independently and added later to the daily output. This output is mutiplied by the catalytic mulltiplier
The goods are circulated between the receiver and the feeder. The feeder in exchange gets cash.
The agents then sell their goods to the public getting cash in return. The price of the good is now decided by an over simplified demand-supply rule. If the demand of the goods is more than the production, the firm decides to increase the price of the good.
Go back to step 1.
For further understanding of the algorithm of the firms and its time evolution, please read the comments in the code tab.
Environment
The firms exist in the 2-dimensional geographical plain, with 32x32 grid size. This geographical environment can be considered actual places in a city where the firms are located.
Another kind of environment that is in the model is the network environment. In the network, an agent is connected to another agent with probability link-prob. So if a link exist between them, it implies that one would help other by providing firms that they require and get money in return.
THINGS TO NOTICE
You can start with these values in the NetLogo, these also should be on the screen when you open it for the first time..
num-firms = 40
cash-in-hand = 6000
catalytic-multiplier 1
link-prob = 0.00
finite-resource : On
resource-used-per-firm 15
resource-growth-per-day 6
working-cost = 4
goods-sold via-link = 5
cost-of-goods = et
manufacturing-limit = 10
max-goods-sold 10
maxiters-15000
When you run with these values You would notice when there are no links, and the catalytic-multplier is zero or 1 most of the firms eventually die. i.e. they use their resources and then sell them without . Notice the patches in the environment.
Now, switch off the "finite resource" and see the changes it made to the patches.
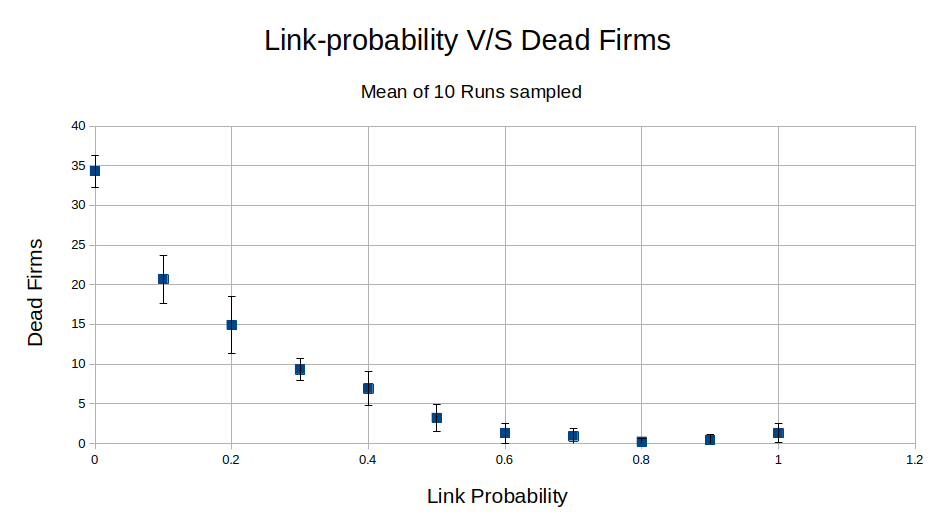
Next thing you can try is increasing the "'link probability". You will notice that with higher value of link-prob, the number of species that go inactive or die decreases rather quickly.
You can look at that in the "Active Firms" plot in the outputs of the model.
Finally and most important increase the catalytic multiplier. To say concrete things about the effect of links we need to be of the order of 20.
THINGS TO TRY
Force Directed spring layout:
When the number of links get very high it can be a bit difficult to look at the structure of the network. To deal with that, we have here a swtich that asks if we need spring layout or not.
When the spring layout switch is turned on, you can then click on the Move button that spreads and positions the nodes neatly.
You can then click back on reset-layout to go back to the original coordinates that firms were announced in the beginning.
Play around with sliders.
You can play around with both resource based sliders to see how one of them being higher can effect the outcome of the model.
You can generate cycles in the graph by deliberately inserting them in the code. Then you can observe their robustness compared to the lone agents.
Behaviour Space
Performing experiment in Behaviour Space. One experiment is already available in the behaviour space. Where we have shown that by increasing links, or connectivity or partnership among firms, the robustness of the system increases. Less firms end up dead.
Summary statistics and plot for the experiment: Image Link
Create your own experiments by playing around with other variables.
EXTENDING THE MODEL
My intention when I started working on this model was to eventually show that these robust structures would arrive in the natural evolution of the network. This needs to be added to the system. I already have a version with evolution, but I am choosing not to submit it as it could get even more difficult to understand and grade.
Certain special types of networks could be used instead of just the random ER network that we generate for the probability like, scale free network or small world network and its effect could be studied.
NETLOGO FEATURES
Breeds
scale-color
RELATED MODELS
Hotelling's law
Wealth Distribution
CREDITS AND REFERENCES
| [1] | Hordijk, W., Kauffman, S. & Koppl, R. Emergence of autocatalytic sets in a simple model of technological evolution. J Evol Econ 33, 1519–1535 (2023). https://doi.org/10.1007/s00191-023-00838-2 |
How to cite?
Please cite the NetLogo software as: Wilensky, U. (1999). NetLogo. http://ccl.northwestern.edu/netlogo/. Center for Connected Learning and Computer-Based Modeling, Northwestern University, Evanston, IL.
Peer Reviews (anonymous) received
For fun, because why not.
Reviewer 1:
A very thought-out model, this is almost too impressive! Just a tiny suggestion, maybe make the interface less cluttered next time. It was quite overwhelming to see and work with. :D
I understand why the person thought so, the other version that I created was less cluttered, but unfortunately, this one had to be as I wanted the most independence in parameter sweeping.
Reviewer 2: This is one of the best models that I saw, but, is too perfect, thinking, positively, I believe that this person do, ALL THE CODE, but it seems like a black hand of AI.
It is interesting when you get accused to be an AI. Honest admission,I used generative AI in grammar check for the documentation before submitting it. But I think AI would not be able to understand my messy code and placements of parameters. Also, this is August 2024, LLMs were not as advanced xD.
Reviewer 3: The model is very well thought out and very well executed. However, the dashboard is too cluttered with information and graphs, and this makes the analysis of the model a little confusing.
Ahh, there is a theme here. I really should declutter. And it is not just for this project. In general I tend to surround myself with things that I might need some day. But that day seldom arrives. I am like old mothers saving those cartons and tupperware. Jokes aside, very good review and important to take such advices seriously.
Reviewer 4: The model conceptualised the forward and backward linkages in industrial economies excellently, with proper documentation. Based on the descriptions, I was expecting to see agent links which were not provided in the model.
This is the kind of review that always confuses the author. The author would like to thank the kind words of the reviewer and also point to the definition of the links above in the documentation.