Examining Disease Prevention Measures within Heterogeneous Communities and Studying Effect of Migration and lockdowns
Table Of Contents:
Introduction
Link to the Presentation for the project
Our Agent based model consists of
In our model agents move randomly
Each agent can either be
Susceptible (Blue Dots in Visualization)
Infected (Red Dots)
Removed/Recovered (Green Dots)
Each infected agent can infect the susceptible neighbours if there exists an S-I link in the corresponding graph within a proximity radius.
!!The Following Simulations go along with the pdf linked above to the presentation!!
The effective Ring spread
In the initial Model, we let the agents perform a 2D random walk across the city (Assumed to be in a rectangular plane for Simplicity) The agents infect using well defined rules around themselves.
We witness a ring structure propogating across the city as we can see in the simulation below :
the structure was also shown in the lectures pointing to this wonderful Science article
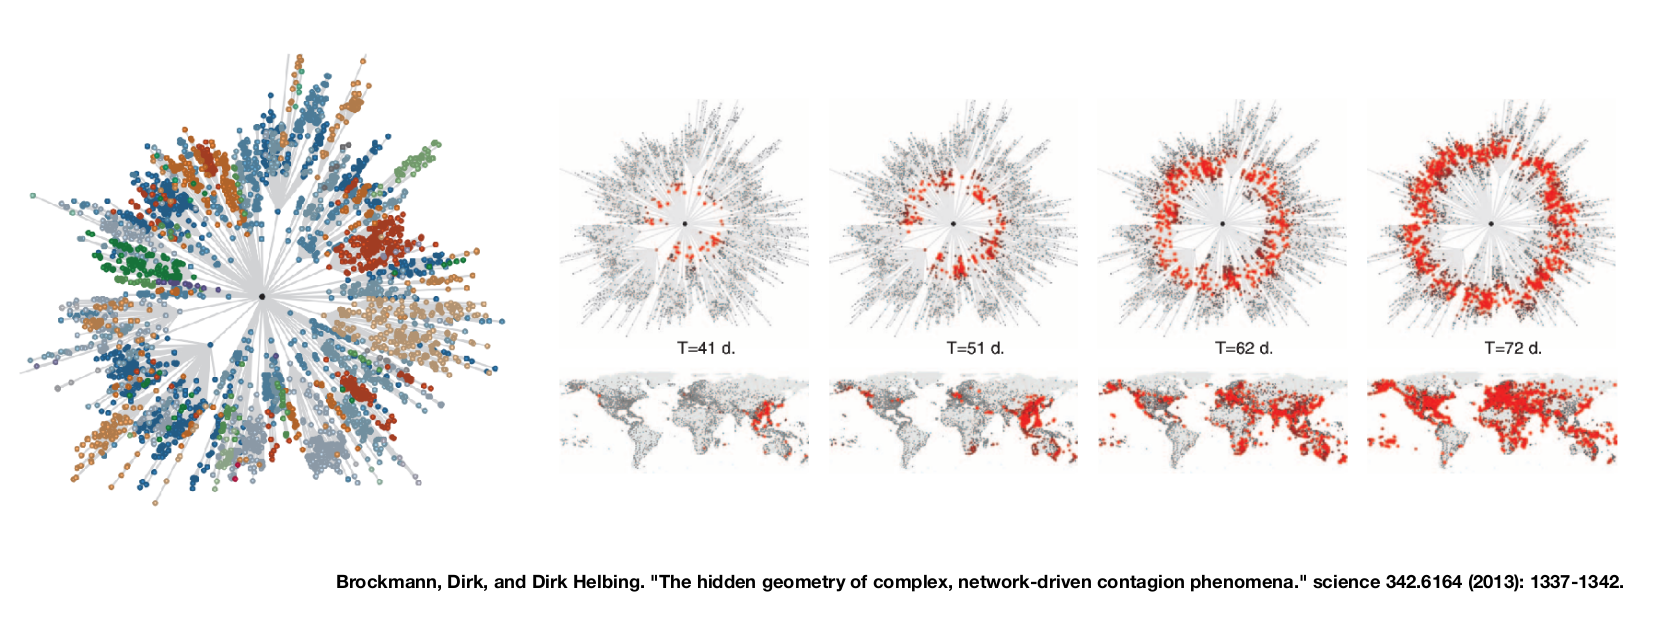
The fact that we get such a structure from our simple model gave us a hint that we were in right direction.
Effect of migration in City A,B and C
Then we studied the effect of Migration across the cities. In the next simulation we sampled 4 cities and initially had one agent infected in each city, we randomly choose a fixed number of people from the city and allow them to migrate from one city to another. The following simulations are the result We can see:
Faster spreading
More hotspots appeaing across the city (not just one where the infection started)
The infection Quickly covers the whole city
So we witnessed a seeding process of infection that lead to faster and deadlier spread of the disease.
We create a quarantine Center outside the city and send the infected individuls that are tested positive to the center.
We make a quarantine center outside the city so that we can send the infected patients that are reported to the centers.
We define a quarantine threshold as the number of days an infected individual is reported
Also define a quarantine Rate that is the ratio of infected individuals that are reported and thus send to quarantine.
The following shows the simulation result