This post is meant to be a supplement to what's coming ahead in a few days. I made this blog to share my exploration and curiosities and Here's me doing exactly that. So let's see what i learned today. Edit: The subsequent posts never came. 😞 Life got in the way and the blog stayed behind. It also moved domains and hosting.
With the ongoing pandemic of COVID-19, the Coronavirus disease outbreak has spread over the whole world, with daily rise in the number of reported cases across the world. Now an important part of dealing with the disease is targeted by understanding how the world interacts as a social network, and Network Scientists are working day and night to understand this epidemic for future predictions. (There is a really wonderful New York Times article titled : "Mapping the Social Network of Coronavirus" I would recommend to read: Link in the end).
So i thought it would be cool to take time out and understand the dynamics of how diseases are spread and understand the mathematics involved.
To study the somewhat complicated equations governing spread of a disease it is important to understand Population Dynamics first:
Population Dynamics : A Primer
The subject of population dynamics deals with the evolution of population of a specie with certain parameters involved(e.g. growth rate, resource limit, etc). Simplest model is often known as Malthusian model of growth:
"Malthusian" Growth Model
We are going to arrive at the Malthusian Model by simple arguments. So to talk about the population growth, we must talk of the Number of individuals of a specie (N) as a quantity changing with time i.e we must talk about \(N(t)\) as a function of time \(t\).
Also the change in quantity with time is given by the derivative of the said quantity with respect to time, so we must study
\[\frac{dN(t)}{dt}\]Now, consider two colonies A and B , A has 50 individuals while the B has 500. Assume on average they reproduce once in a few days and both have same rate of reproduction. We count again after a few month, which colony do you expect to have grown up better?
You expect Colony B to do much better right? So Intuition tells us the change in population must be proportional to the population itself. i.e. At time \(t+\delta t\) the population will be proportional to poulation at time \(t\). Thus we can say:
\[\begin{aligned} \frac{dN(t)}{dt} &\propto N(t) \\\ \frac{dN(t)}{dt} &= rN \end{aligned}\]Here r is the proportionality constant and shows us how strong the rate of increase/decrease in the population is. It is known as intrinsic rate of increase because r depends intrinsically on the system. So what known rates can you think of that intrinsically define a population? The most obvious answer are Birth and death rate. In fact we can define our intrinsic rate to be equal to the difference between the birth and death rate.
\[r=b-d \quad \\ \where b=Birth Rate and d=Death rate\]Now this differential equation is not really difficult to solve : the solution is given by :
\[\begin{aligned} \frac{dN(t)}{dt} &= r.N(t) \\ \frac{dN(t)}{N(t)} &= r dt \\\ log_e\left( N(t) \right) &= r t + c \implies N(t) =N_0 . e^{r.t} \end{aligned}\]In the solution above \(N_0\) is the population at time t=0 and shows exponential change in population. Based on sign of r the population can either exponentially increase or decay to zero. The graphical solution for this is really interesting: The Red Curve shows the increasing population with r=0.5, while the blue curve shows the same solution with r=-1 and both solution had same initial population.
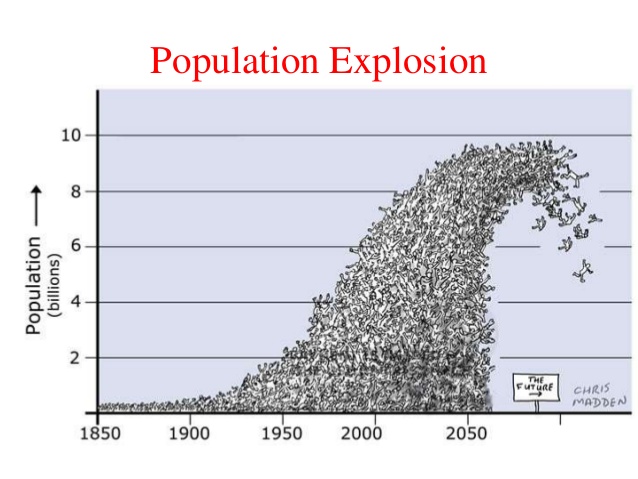
The calculations of the same kind of equation were the basis of Thomas Malthus's essay on the Principles of Population (1798) in which he predicted the collapse of Human Specie into an ever increasing Misery and chaos if we don't abstain from Procreation. Thus this model is known as Malthusian Model.
Logistic Model/Verhulst Model
Time for a logical Leap that Verhulst also took when he read Malthus's essay. He realized that there was a need for the obvious limit to the explosion of population with positive growth rate. Malthus himself argued about the fact that there is a finite rate of production of food and if we increase our population dramatically there will be a catastrophe which we call a Malthusian Catastrophe (link) . Verhulst introduced a term that's known as Carrying Capacity, a limit to the population.
Thus we need the right hand side of the Differential equation to be zero when N is equal to Carrying capacity C, one way to do that would be to multiply a term \((N-C)\), but this leads to quadratic increase in population and for small population our model must mimic the primitive model. We can also use fraction \(\frac{N}{C}\) which goes to 1 when N goes to K thus the Differential equation is given by:
\[\frac{dN}{dt} =rN \cdot \left( 1- {\frac{N}{C}}\right) \]Here C is the carrying Capacity of the population. This equation is famously known as the Logistic Equation and arrives in various fields like Physics, Medicine, Computers, Networks, and Ecology.
The solution again can be found out as we did in the previous case albeit a bit more calculation is needed. Any standard ecology book will have the solution and you can look it up.
Solution is given by :
\[N(t)={\frac {C}{1+\left({\frac {C-N_{0}}{N_{0}}}\right)e^{-rt}}}\]The solution is a sigmoid curve: C is The highest value that the population can reach given infinite time (or come close to reaching in finite time). It is important to stress that the carrying capacity is asymptotically reached independently of the initial value. So , does it mean the world population always reach saturation?
No here, we must understand that these models, although show really good approximation to real world populations of bacteria and other primitve organisms , human ecology has many variables and much more terms that one must take into account.
For example if the population reaches the carrying capacity the limited resources on earth would come into play, there will be a time when we would run out of the resources to survive and the sigmoid curve will dwindle.
We can have terms that involve Inter and Intra specefic competition, We can dynamically study different species hunting and boosting each other.
In the next post we will discuss a model for Disease Spreading and perhaps hopefully try to explore some real life data involving COVID-19. Untill then Stay curious!
NYT ARTICLE: https://www.nytimes.com/2020/03/13/science/coronavirus-social-networks-data.html
title: "Understanding the dynamics of Disease Spreading : Basic Population Dynamics" date: "2020-03-15" categories:
"mathematics"
tags:
"coronavirus"
"covid-19"
"disease-spreading"
"mathematics"
"population-dynamics"